The performance of your website is a key element to analyse
Jahia Team
Kissmetrics says that 40% abandon a website that takes more than 3 seconds to load. A single second delay in page response can result in a 7% reduction in conversions. Speed really matters.
Technical Consultants at Jahia became extremely good at troubleshooting page performance issues and dramatically optimizing rendering time. A load time of 100 milliseconds thrill us while anything longer than 0.5 seconds will be frowned upon and the reasons for slowness will be hunted down. Troubleshooting global performance issues can be a complex task depending on the cause, understanding why a given page is slow should be a no-brainer.
We also know too well what silos exist in the real-world. Marketing and communication teams will realize first hand that a page has become too slow to ignore, but only developers and sysops have the keys to understanding why that is.
This is the reason why we decided to develop a tool available to content authors and developers, that will provide clear and specific insights about the reasons of page slowness: here comes the Performance Analyzer.
How did we build it?
In Jahia DX, pages are composed of one or multiple component(s). Each component being represented by a cache fragment in the page. Here is a basic example of a page which contains 6 components (a menu, a big text, a link image and three highlight components)

The page render time is the sum of the generation time of each fragment of the page and some additional factors (authentication, application server overhead…). To be able to get the individual render time of each fragment, Render Filters are used in order to capture the start and end timestamp of the generation of fragments.
Render Filters can be executed at different stages of the generation of a fragment, making our job really easy.
The small challenge was to avoid counting time twice: Jahia DX fragments are executed following a tree structure. A fragment representing a content list containing two news items will render only when its two subnodes have been rendered too. We had to take the fragments' depth in the tree structure into account in order to obtain meaningful durations.
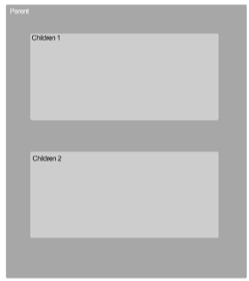
Real Time of the Parent = Total Time of the Parent – (Time of Child 1 + Time of Child 2)
Of course, this is a minimalistic example. Real Jahia DX page structures could contain fifty components with 10 depths level, making the use of a tool much more convenient than doing math by hand.
How to use it?
To get started, you need to install the performance page analyzer module on your Jahia DX and activate the module on the website where you want to run the analysis.
You will find a "Performance Panel" entry under your "Site settings".

First you have to select a page or a piece of content. To do, click “Choose page to Analyse”.
The “Flush cache” option can be used in order for the page cache to be flushed before launching the analyser. Some pages can show performance issues when they are not in the cache, while leveraging the native HTML cache will make them way faster. When in doubt, doing a page performance comparison with and without cache can help troubleshoot issues.
When ready, click on the “Launch the page performance analyser” button.
Then you will see on the top all the information that corresponds to the total time taken to load all the elements, the number of elements and the name of the page.

You will then see a table with all the elements information. You can order the table, and change the number of elements per page. By default, slowest elements are displayed first. It will help find the elements that slow the page the most.

As you can see in the table and on graphs, there is an element with the name of the page (here home) and the node type “jnt:page”. This time corresponds to elements that are outside the render chain, and out of scope of this tool. For example authentication valve, Jahia DX overhead outside of the rendering chain, application server overhead, …
If the out-of-scope time is significant compared to the rest of the components, it means that page components are not the entire reason for a page to be slow. Other reasons need to be investigated, such as authentication valves, network latency...
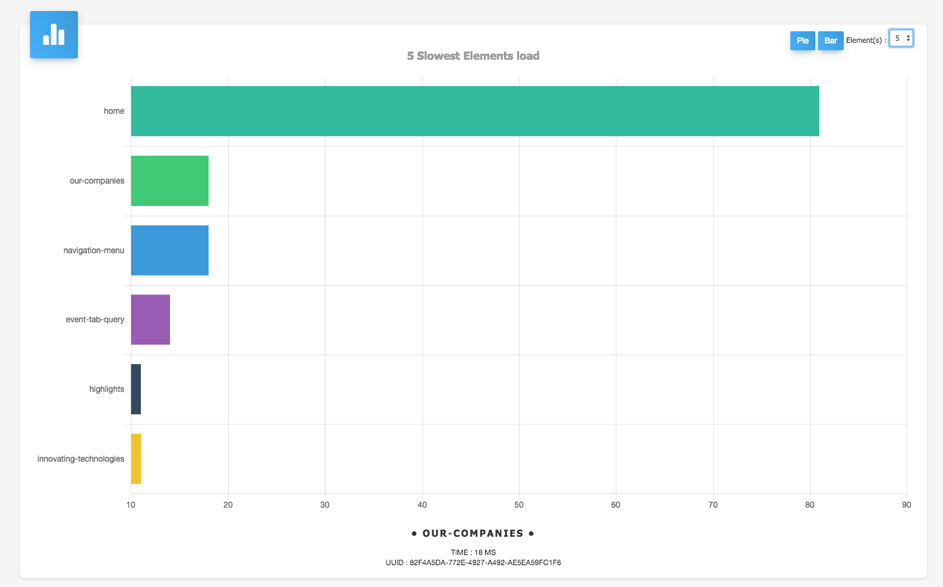
You can now see on the bottom of the page, a pie chart that shows you the 20 slowest elements of the page:

These graphs can be shown as bar charts, and the number of elements to show can change between 5 and 20.